2020 – Year in Review
It’s that time of year again! Let’s take a look into some of the stats of what was certainly a crazy year.
Let’s take a look at some of what I said to start off 2020:
So looking forward to 2020 goals: I want to continue to make strides with working out more.
Nope.
I want to finally have a year where I drink less than the year before. It’d be nice to be around 125 or 120 again.
Yes! Down to 105. Sub 100 next year?
For finances, I really just want to keep doing what I’m doing, regardless of what the market or future election has in store for it.
I did pretty good here, even with the threat of COVID wiping out all the financial gains I had made, I held steady and continued to contribute to my investement funds.
I want to finish MM blindfolded.
Finished! AND started another blindfolded project!
We’ll see how OoT kind of shakes out, but it’d be cool to be top 10 in a category or two again.
HAHAHAHA good one, past RG. Top 10 in OCS standings though…
I want to write more for this page!!
Didn’t happen…The things I was discussing doing this with I think I’m going to try and do more vlog style in 2021. See how that goes.
2020 has some very interesting stats. For example, check out “Distance Ran by Week” chart:
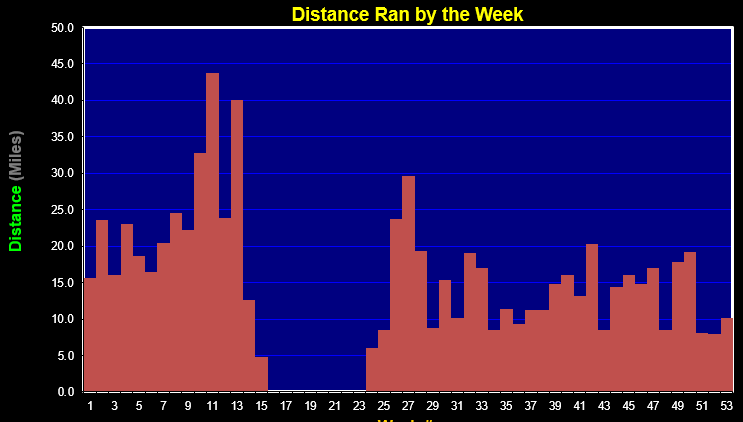
I wonder, what could have possibly happened there around April? This is the least miles for a year I’ve had in quite some time (754.4). It’s really a shame, because from this chart you can actually see I was ramping UP my miles. In fact, I was training to run a marathon for the first time since 2011. Unfortunately, as we all know, COVID hit and the marathon was cancelled. I made a conscious decision at that point to take some time off running, since it had honestly been years since I had more than 7 days in a row off. I’m not sure what my running goals are for this year, I think I would like at least 1000 again though.
Let’s take a look at my drinks:
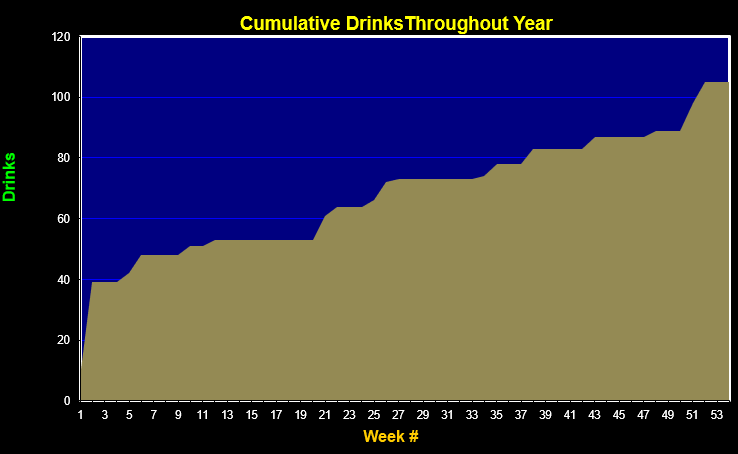
I think this is the most ‘step’ like this graph has ever looked. Meaning, I’ll go weeks at a time with no drinks, and then have like 5 or more in one night. Also note that we basically started the year at 40…thanks to AGDQ. This year, there is no in person AGDQ, and SGDQ is honestly quite doubtful as well. So I expect to see my drink numbers drop significantly. Under 75 is definitely reasonable.
Looking at my weight:
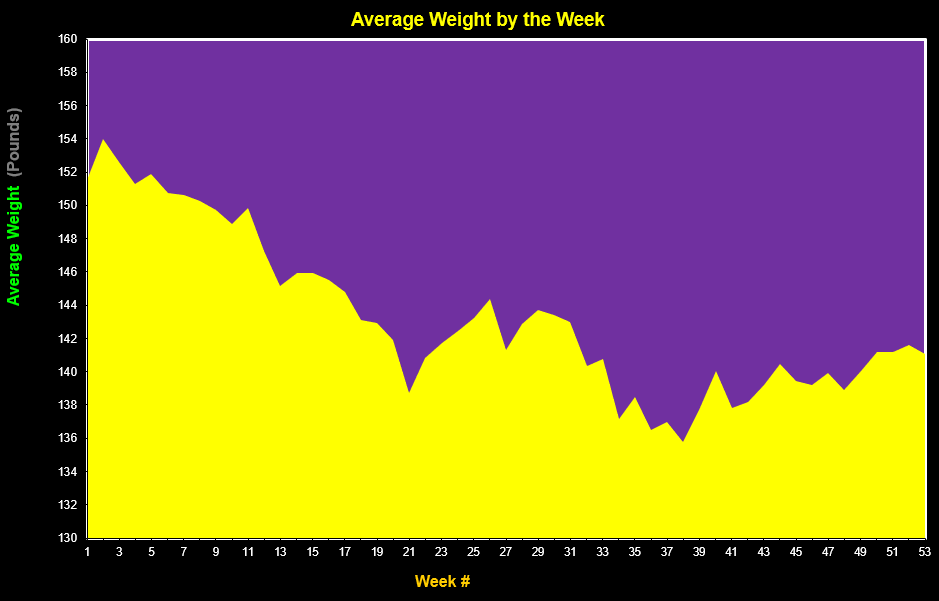
This wasn’t a conscious decision to lose weight…it honestly just kept melting off. First, training for the marathon definitely was shedding some weight. Second, I wasn’t working out anymore, and definitely some of this loss is muscle mass, unfortunately. And third, with the quarantine I had very little incentive to eat out for dinner or drink anything. I cooked pretty healthy meals at home and it honestly shows with this graph. We actually got all the way down to around 135lbs, which is insane…that’s a weight I haven’t hit since around 2011. I did come back around to 140lbs though after September, and sort of chopped around there, which seems to be around my ‘base’ weight.
Let’s look at hours slept:
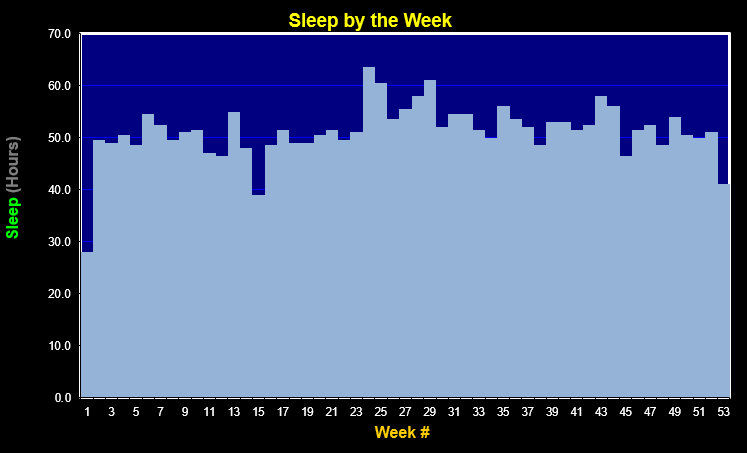
Now, until about week 23 (End of May/Early June) my sleep was fairly consistent, outside of one somehow brutal week with only 39 hours of sleep. Other than that, it hovers around 50 (~7 hours a night). But then something happened. I even complained about it in my discord:
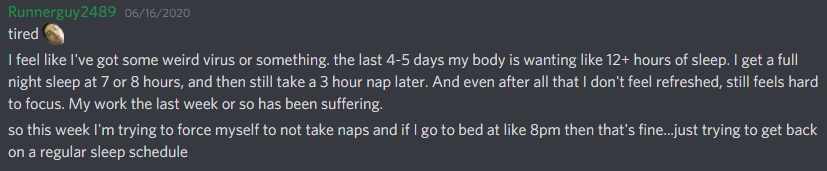
I actually still don’t really know what is wrong with me, physically. Fatigue is the number one issue though. I tend to not need 12 hours of sleep like that 2 week period in June…but you can see the sleep never really gets back to that 50 level again…it kind of oscilates back and forth, and seems to be trending back that way…but I still feel out of it sometimes. It seems like for 7-10 days I’ll start to feel like myself, and then for another 7-10 days it’ll feel like I’m fatigued and struggling again. One of my goals for 2021, and I’ve told myself this for years, is to GO TO THE DOCTOR. I’ve just put it off and put it off, and I really do need to go and find out what is happening with me. It’s just been tough with everything else going on in 2020 and me not really taking the time to sit down and pick a doctor and schedule a visit. But even with COVID, I need to do this. I’m not 22 anymore, I’m almost 32. And while I’m add it, add getting back to the dentist and eye doctor…because I didn’t do those in 2020 either ugh. I go through all these charts about health and running and everything, and at the end of the day I need to do a better job of actually getting my body checked on. The stats can only carry me so far.
Alright, into some financial data! I completely revamped my organization of this data in the past year, and I LOVE how it turned out. I’m still doing this in excel, but now I’m exporting pretty much everything to a csv, so I can keep 2020 data separate as I go into 2021, or combine them all together, or use another program to analyze it further. So many possibilities.
First, I have all of my expenses sorted by two categories (a main category and a sub category, if you will), and I have a table compiling all of this by month:
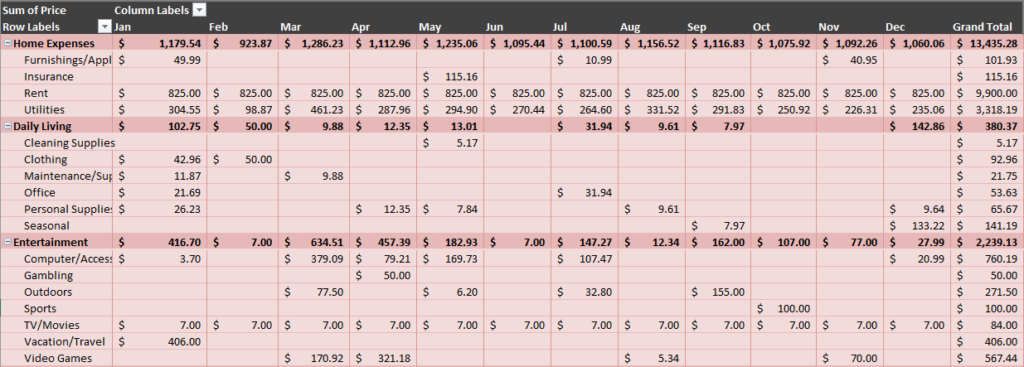
These are just a few categories…it’s a whole long list but I didn’t want to screen capture the whole thing. You can see how everything is broken down. Really nice details! It also gives me grand totals for the year…so I can very quickly see I spent $760.19 on stuff for my computer. I also have this type of thing in a pie chart format:
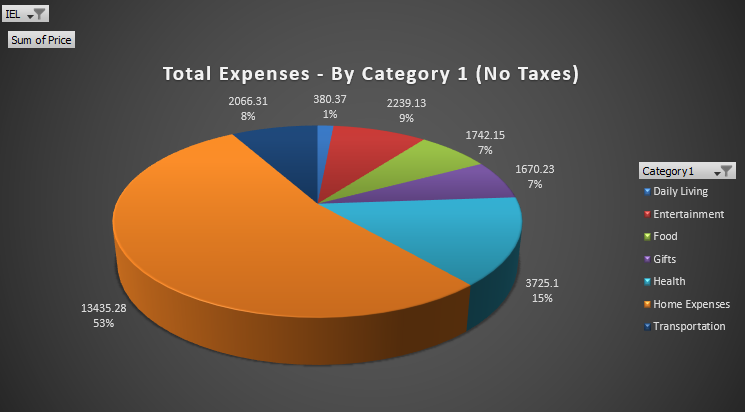
I have several “Category 1” groupings: Daily Living, Entertainment, Food, Gifts, Health, Home Expenses, and Transportation. Then, for each one of those, I have the “Category 2” groupings. In this second pie chart I show the “Transportation” breakdowns: Fees, Gas, Insurance, Parking, Repairs, and Ride Share. I’d put a car payment here too but it’s paid off. As you can see, my insurance is stupid high, especially for the amount I’m driving (seriously…$265 for the YEAR on gas!) I’m gonna look into changing my insurance this year for sure. Speaking of the gas, I can also see graphs like this:
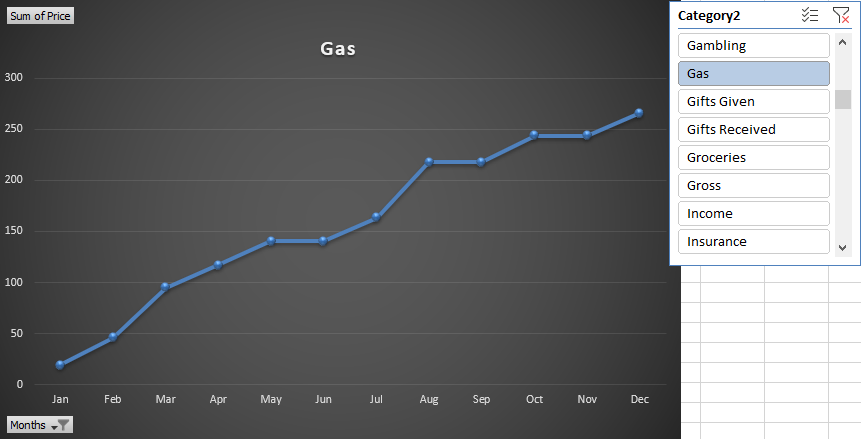
This shows a month by month CUMULATIVE cost throughout the year. I could also do this with a bar graph for each month, but I kind of like to see the cumulative ones here. For me, spring and late summer are the times I’m out driving around to forested areas the most…so this makes sense. I found this one interesting on “Entertainment” as a whole:
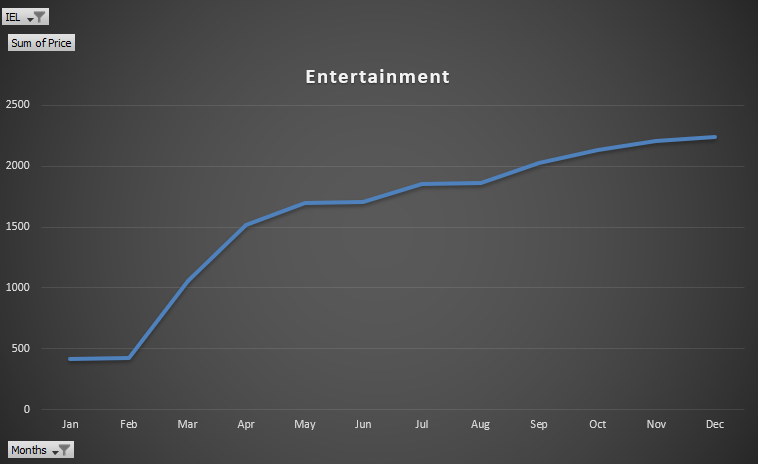
I spent a lot right around the time COVID shutdowns were happening (Nintendo Switch, computer upgrades, etc.), and then not all that much throughout the rest of the year.
I always like to compare INCOME minus EXPENSES for each month to see if I am ahead and saving money, or behind and losing:
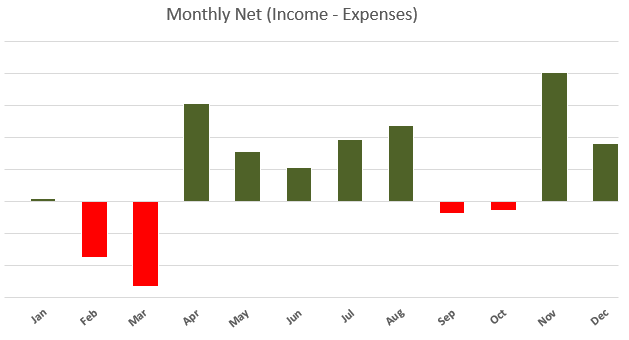
…This chart is getting kind of unhelpful though…as it is sooo vastly tied to what the *market* is doing (since that’s where most of my net worth is). And so it makes fairly normal months like January or October look like nothing…no problem, I just filtered out all of my investment accounts:
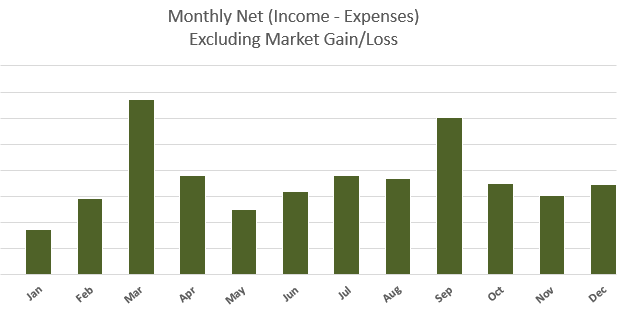
BOOM, all green! Realistically though, this one is a bit deceptive too I think…because it has my gross income but doesn’t take out my taxes…so I should probably keep tweaking it to get a true sense of “Did I spend or save money this month?” The great thing though is: These charts are super easy to manipulate and filter with the way I have the data set up. So maybe next year I’ll have even more!
As always, I like to then take my net worth every month…and put it in one large chart throughout most of my post-college life as an engineer:
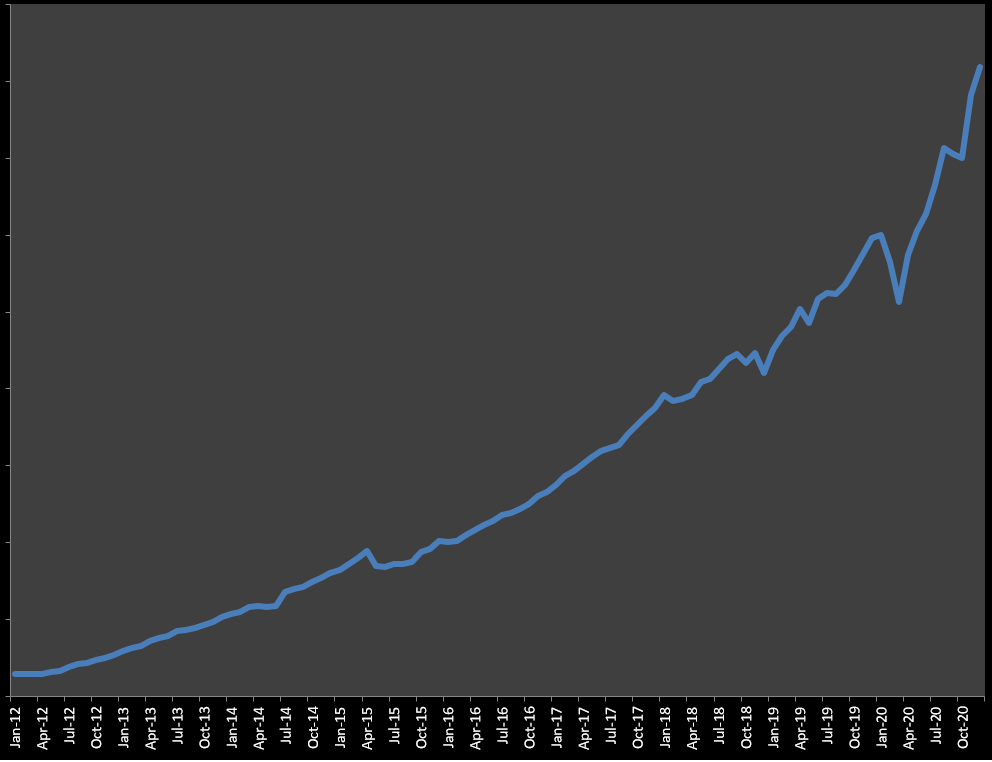
Um…yeah this is just silly at this point. Even without the y-axis you can tell 2020 had huge financial gains for me. The dip from COVID is almost like nothing…the markets rebounded and a lot of my retirement accounts bounced back. I’ve always had the goal of retiring early, and saving comes pretty naturally to me. I’ve been so fortunate in my life to have the opportunities I have had…but still I always was proud of the work and effort I put towards achieving a net worth graph like this. But to be honest, this was the first time I looked at this graph and felt…a bit guilty. Like, so many people are struggling this year. Stressed about COVID, lost their job, or just poor conditions of living in general. And I’m just sitting here socking away more and more money. I’ve tried to do a few charity streams a year to give back…but it really feels like I should do more. At least at some point. I want to reach my retirement number and then see…if I still want to work for a few years and really do a lot of charity work I might. If I stop my engineering job I may look for other charitable things to do with my time. That’s the beauty in my eyes of an early retirement: You have a lot more control over how to spend your time and how to make an impact for others.
Takeaway/Goals for 2021:
- GET TO A DOCTOR OMG
- While you’re at it, get back to the eye doctor and dentist too
- 1000+ miles run for the year again
- Reduce alcoholic drinks, under 100 for the year
- Look for a better car insurance plan
- Finish 100% OoT Blindfolded, start glitchless blindfolded runs after that
- Stream more games! Who cares if it’s not OoT? It’s not like I rely on the viewers/subs for income anyway…
- Pick up a speedrun of SOMETHING, please…I really would like to do something again…
- Try and encourage/acknowledge others more on social media. It’s too negative of a space…I want to be more positive on it.
So that sums it up for this year! See you all next year with some more stats!
looks like theres room to up the budget for mod salary
Hello! I am John Vandevert,
I found out about you from the ‘infamous’ ‘Can you stop’ video, however after learning about your commentary found on Reddit a couple years ago, I really loved your insight and the intellect applied. I am following your blog and would love to be your friend, as you seem like a incredibly cogent young individual!